- Font Size
- A
- A
- A
-
Printer-Friendly

SAPPET allows users to view indicator prevalence and trend graphs for all 50 states and the District of Columbia. Depending on data availability, users can also customize graphs to compare state and national trends, compare trends across states, and select specific time frames and confidence intervals. For some data sources, users can also create sub-state (county) level graphs.
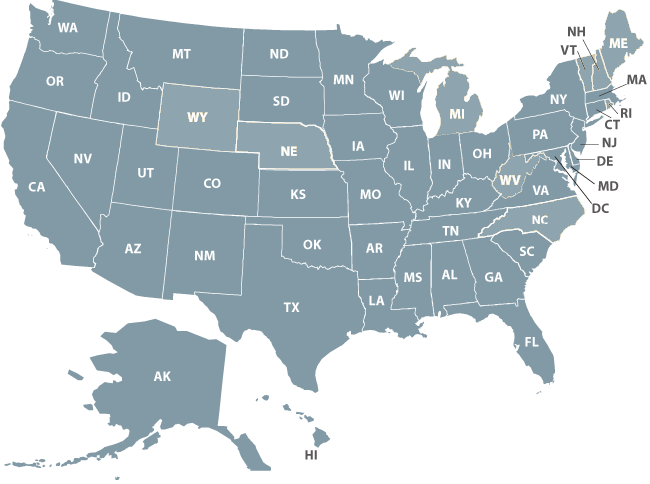
To view data for an individual state, select the state from the drop-down menu or click on the map below.
Please choose:
|
 to download this FREE program.